
Scaling with Meteor
From 0 to 1000 users, and everything in-between.
After months monitoring and tuning my Meteor app for Skoolers Tutoring, I’ve finally hit peak traffic expected for the app at over 1000 daily active users (DAL). Since there is a limited number of students enrolled at any one time, I can plan on being prepared for this level of traffic, and any expansion plans will probably come with sub-domains running completely independent versions of the app.
With the countless forum posts online asking how does Meteor scale?, I thought I share the results I saw in a real-world app.
App background
Many answers to the often asked ‘how many concurrent users can my server support?’ come back with ‘it depends’, with good reason. I will try to break down my app as an example along with results of real-world testing to help present a baseline of what to expect.
If you don’t feel like reading all the details about the app, then just read this summary. I consider my app to be on the heavy side of what a Meteor app can be expected to provide. It uses a large number of publications, some of which can transfer hundreds of KB of data, for each student, and has a number of features which result in constant Meteor method calls.
While I rely entirely on third party services (AWS S3, Vimeo, Wistia) to deliver all the heavy static assets (PDF’s, hosted videos), but the Meteor server is still heavily used to provide real-time data to the clients and record nearly all client interactions via method calls.
Does it scale?
Why yes, it sure does. I’m currently supporting over 1000 DAL with 1-3 Galaxy compact containers, with container numbers managed automatically by my galaxy-autoscale package.
While I had to do a lot of performance tuning of inefficient pubs/methods as I went, there were three major steps which dramatically improved the app performance, allowing me to serve more users with significantly less resources.
Initial public launch
I was fortunate that I initially launched the app against less than 1/10th of my actual peak expected audience, which gave me months to observe the app in real-world use and ensure it was ready for peak load. I released the first version at the start of the summer semester, with very few students enrolled in courses.
If I didn’t have this luxury of gradually increasing usage, I would have needed to do more load testing, which I think is a tricky thing to do with Meteor given the async nature of it’s publication loading and method calls.
Performance boost #1 - MongoDB Indexes
This one is obvious, but it’s one of those tunings you either need experience to know how to do right, or you wait until your app is getting some usage and take a look at the ‘slow queries’ tools provided by your MongoDB provider and add the indexes it recommends.
I started off without adding indexes besides those included by default, and the graphs showed the database working pretty hard when it shouldn’t have been. This graph covers the period start at first public launch to when I started adding in indexes, and it’s easy to see the transition.
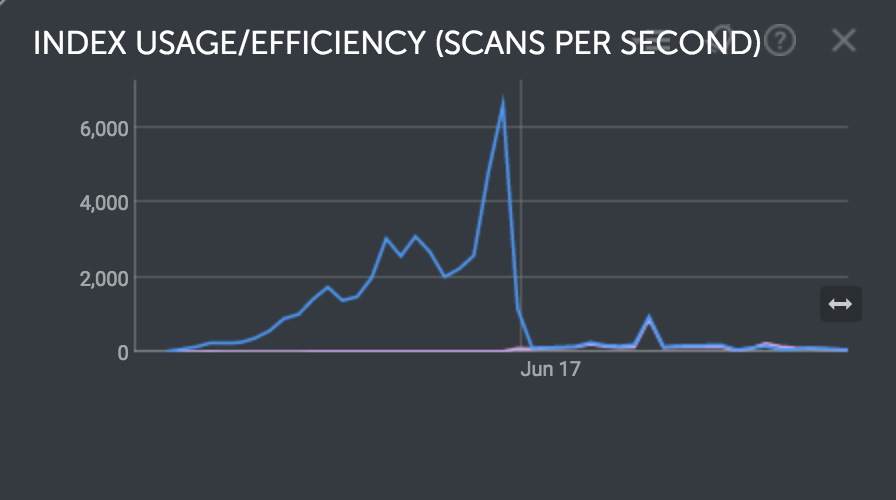
That peak in the middle is the database scanning through over 6,000 documents per second on average, at a time when my DAL was just over 200. That purple line that looks like a zero is actually the number of documents found via indexes, it’s just too low to be clearly visible. Definitely some easy optimization to do here.
Again this step was easier than it sounds, just go through the ‘slow queries’ tool in your MongoDB provider, evaluate which indexes it recommends and add most of them. The only ones I didn’t end were queries that were inefficient due to third-party packages I was using where I couldn’t easily edit them to take advantage of the indexes.
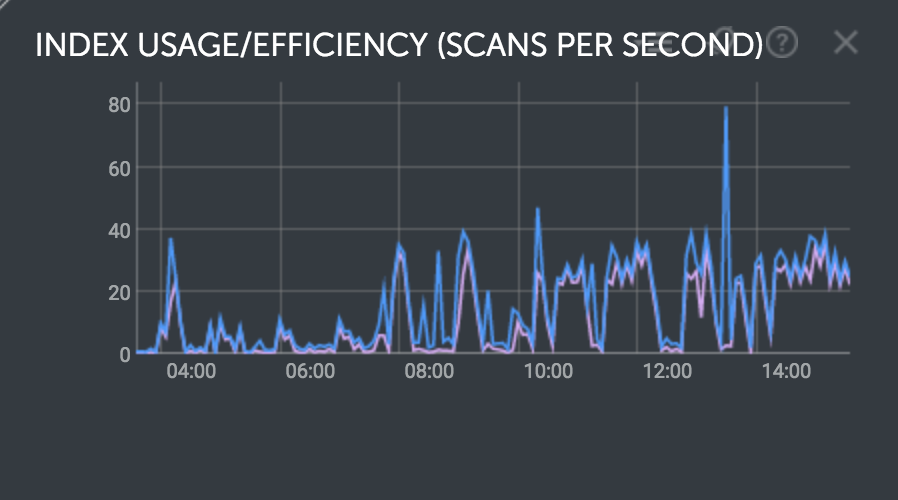
The easiest way to evaluate the effectiveness of this is to add the indexes, observe the difference over 24 hours to verify the improvement you were looking for, and keep going until you are satisfied with the coverage of your indexes. This is what the same graph looks like now.
Performance boost #2 - Oplog Tailing
After first setting up my production/staging environments and doing some limited tested, I tested enabling oplog tailing and saw that it led to noticeably higher idle CPU usage. This was before I had done any significant optimization work, and I’m not sure why I saw these results, but either way I decided at that time to disable oplog tailing.
This turned out to be the wrong choice, as I saw when I later re-enabled oplog tailing much later. The good part about this test it I was able to collect some real data on exactly how much better Meteor performs with oplog tailing enabled.
Before oplog tailing
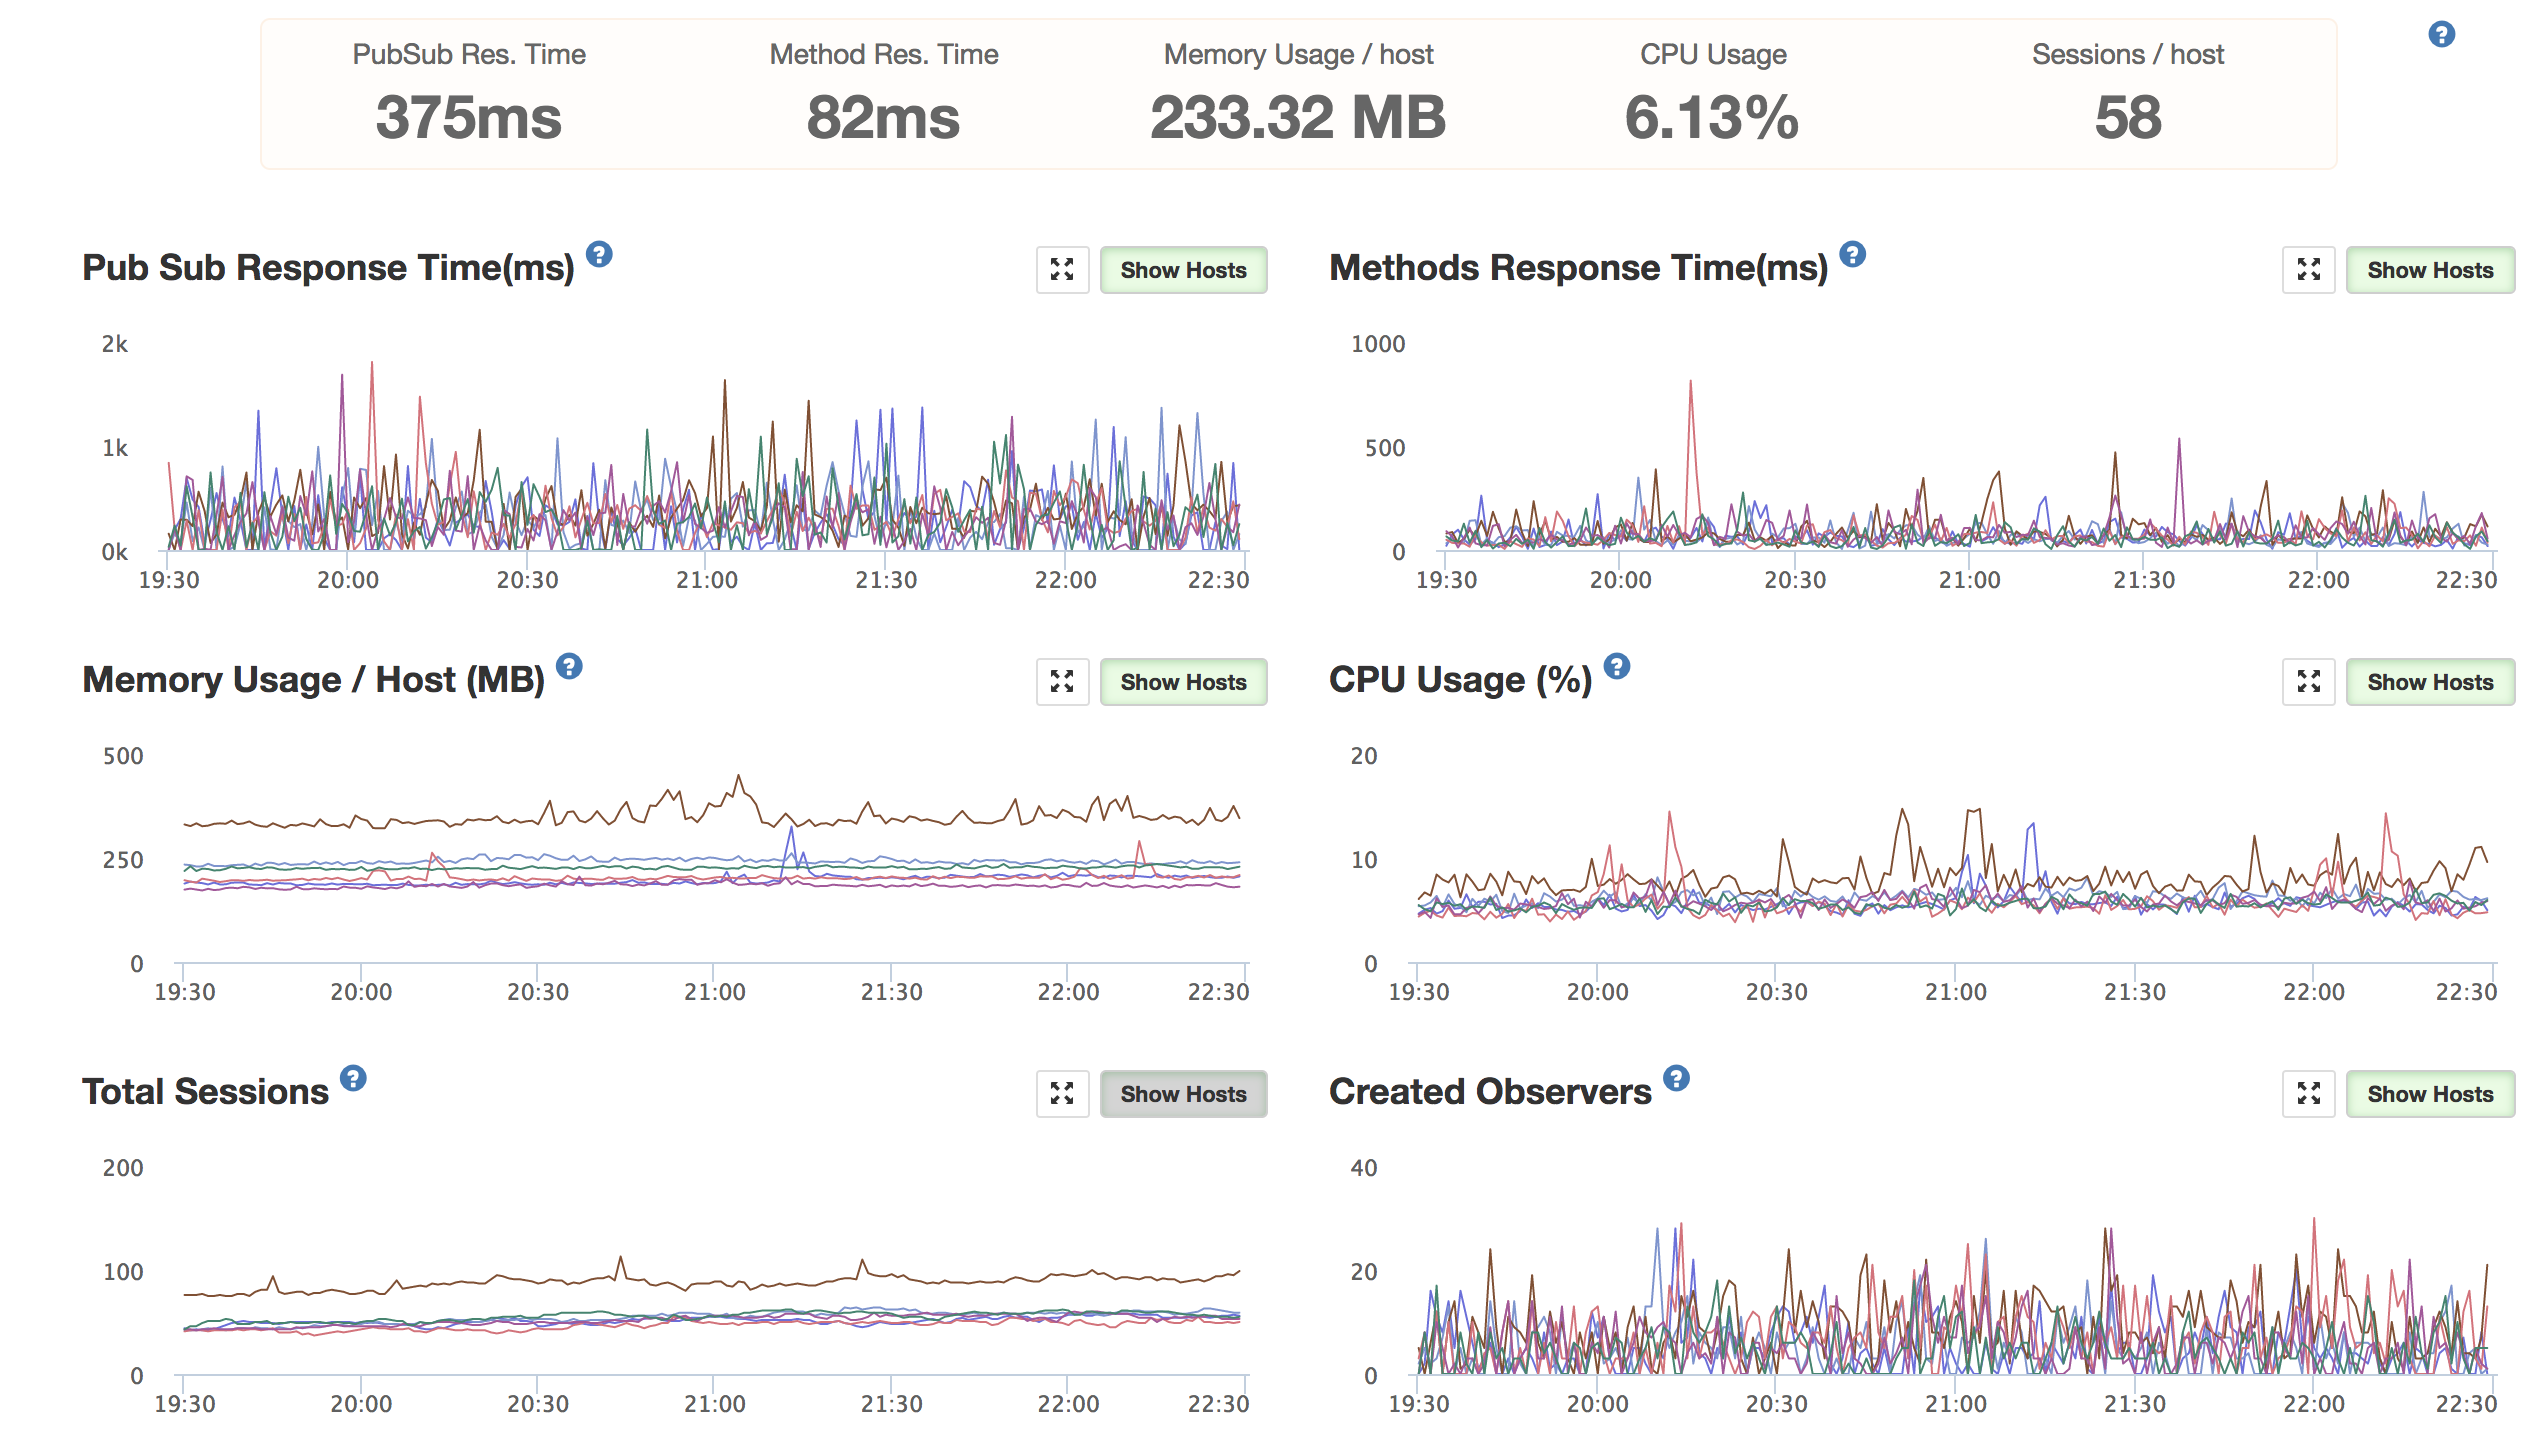 Note about CPU usage graph: the % doesn’t take into account container size. With compact size, the CPU maxes out at 15%.
Raw stats:
- 6 compact containers (0.5 ECU, 512 MB each)
- ~200 unique users, with ~350 total connections
- Average CPU at 40%, average memory at 235 MB (45%)
Calculated stats:
- 1.4 total ECU used, 1.4 GB memory used
- 0.7 ECU, 700 MB memory used for every 100 unique users
Since I always wanted to have excess resources available, I can look at the numbers to come up with some decent estimates on how many resources I’d want to allocate based on concurrent user load.
Pre oplog tailing resources required for every 100 unique users:
- 1.5 ECU
- 1.5 GB of memory
After oplog tailing
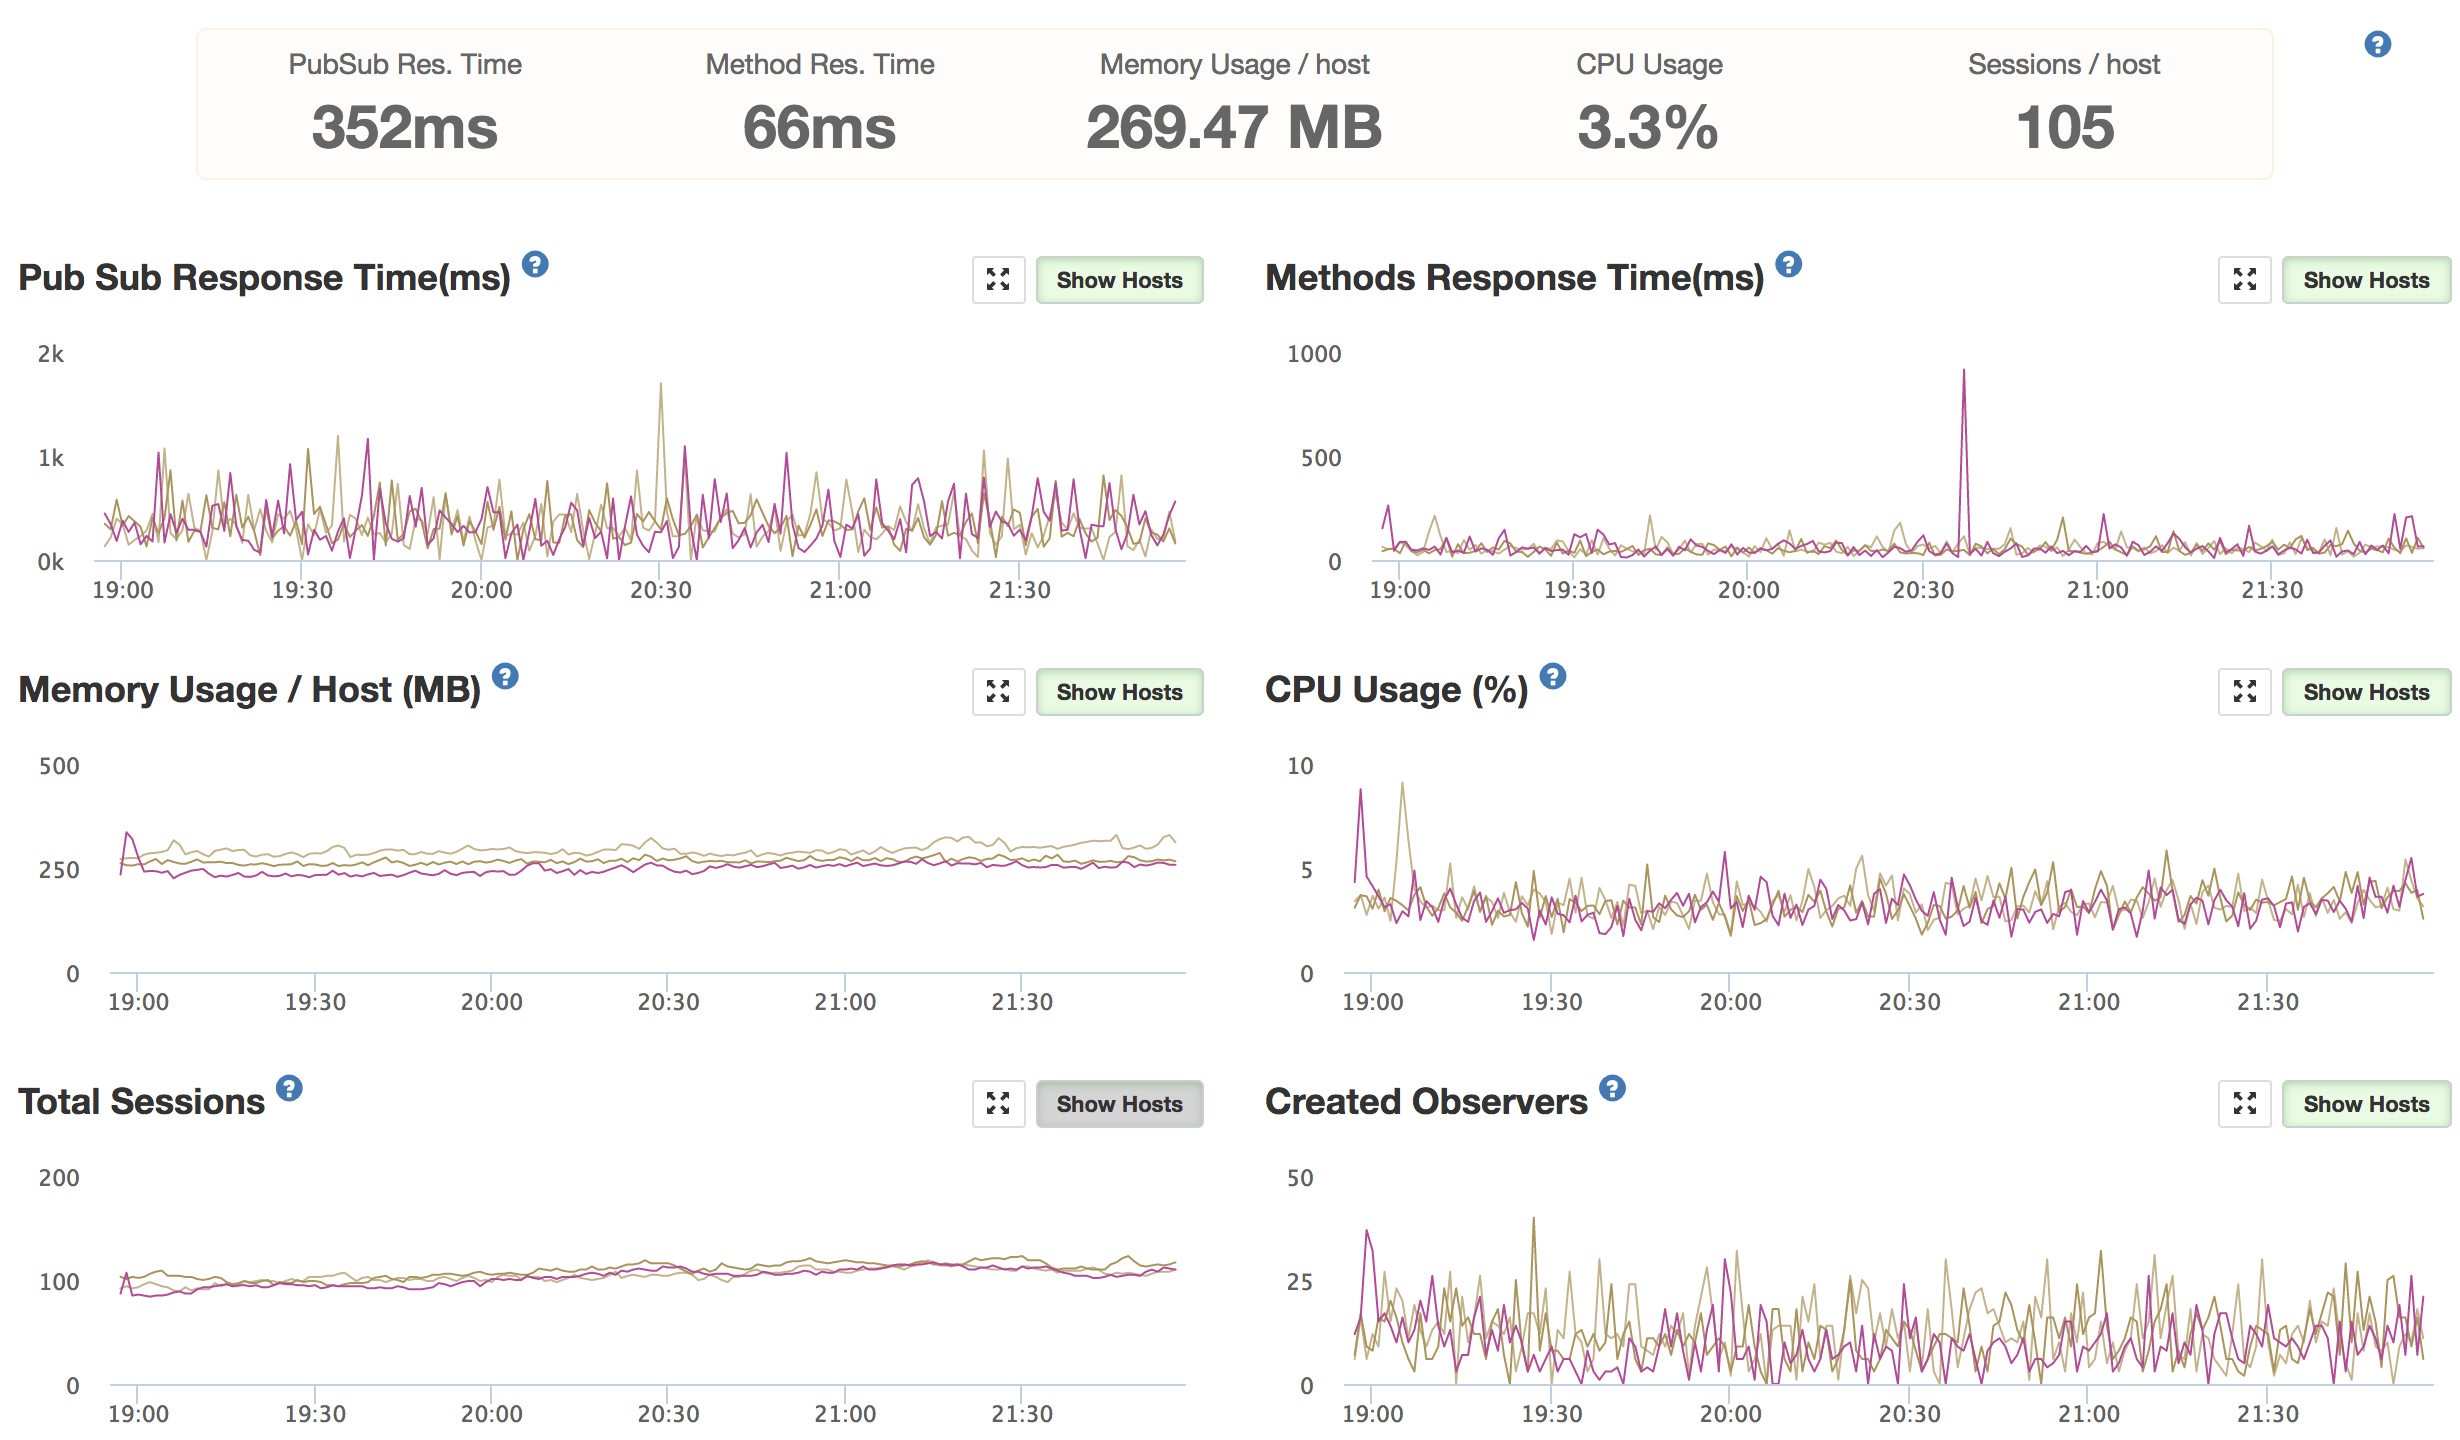
These were taken the day after the above data set, with no other major changes made the app or database. Luckily user traffic was almost identical, allowing for a great comparison.
Numbers:
Raw stats:
- 3 compact containers (0.5 ECU, 512 MB each)
- ~200 unique users, with ~340 total connections
- Average CPU at 25%, memory at 273 MB (53%)
Calculated stats:
- 0.38 total ECU used, 820 MB memory used
- 0.19 ECU, 410 MB memory used for every 100 unique users
Looking at the steady state load, I adjust the margins I’m comfortable with and come out with new resource requirements.
Post oplog tailing resources required for every 100 unique users:
- 0.5 ECU
- 512 MB of memory
I’m going closer to the memory limit here, but in general memory usage is very stable at this point.
Effects on MongoDB
While my database provider never slowed down my app, it was clear that the pre oplog tailing was putting an enormous, and unnecessary, burden on the database. Looking at a few of the MongoDB graphs covering the same period before/after the transition to oplog tailing, you can see the dramatic difference in the amount of documents requested by Meteor.

Before oplog tailing was enabled, my cluster of Meteor containers were requesting and processing 1000 documents per second and 18 Mbps of data from my MongoDB cluster to support only 200 unique users.
After oplog tailing, those figures dropped to 80 documents per second and 400 Kbps of outbound data. That’s a lot less unnecessary work processing all that duplicate data
Performance Boost #3 - Offload cron jobs
I initially used synced-cron to manage a number of maintenance scripts. After traffic picked up and my containers were pushed closer to their limits, the scripts would sometimes bump up memory usage of a container enough to kill itself.
Rather than run these scripts on client facing servers, I shifted this to a cheap AWS EC2 server, deployed using MUP, and disabled synced-cron on the client facing servers. This led to extremely smooth CPU and memory graphs, allowing me to run closer to the limits without getting occasional memory kills or CPU pegs.
Final thoughts
The app now runs very smoothly on 1-3 compact containers, using my galaxy-autoscale package to bump up or down container numbers with shifting load. While it took a bit of work, Meteor ended up scaling to exactly the level I needed within my low budget of $100/month.
Given the ease the entire development process was from start to finish, and the efficiency of the current application, I plan on continuing to use Meteor for future client projects :).